Singsys: Best Taxi Booking App Development Company in Singapore (2024)
Taxi Booking App Development Company in Singapore

It has always been very frustrating to detect and solve problems with API calls when you are developing a mobile application or technically anything which consumes web services.
We simply fire an HTTP with hope that we will get the right response what we expect. But it doesn’t work that simply. It takes plenty of time to diagnose the problem and find the root cause at the first place. Runscope here has done some serious work to help you out with these problems. You may have used hurl.it for making HTTP request from the sketch; this tool is also developed by Runscope.
In actual, all your requests are passed through an intermediate server of the Runscope. They forward the request to the destination server, capture the output and the same output is returned to in the response to the originator. They have an URL helper help which converts your URLs to the corresponding URLs of their server.
Below, I am listing out some of the most useful features of the Runscope.
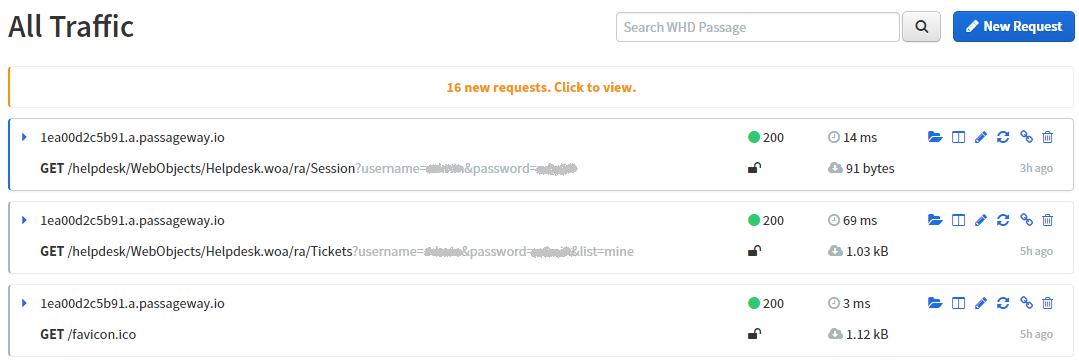
Runscope has a page called Traffic Inspector. Here, all the new API calls are logged in the real time. You can see all the details of an HTTP request by clicking on a request.
Below screenshot demonstrates how it looks when new requests arrive in real time.
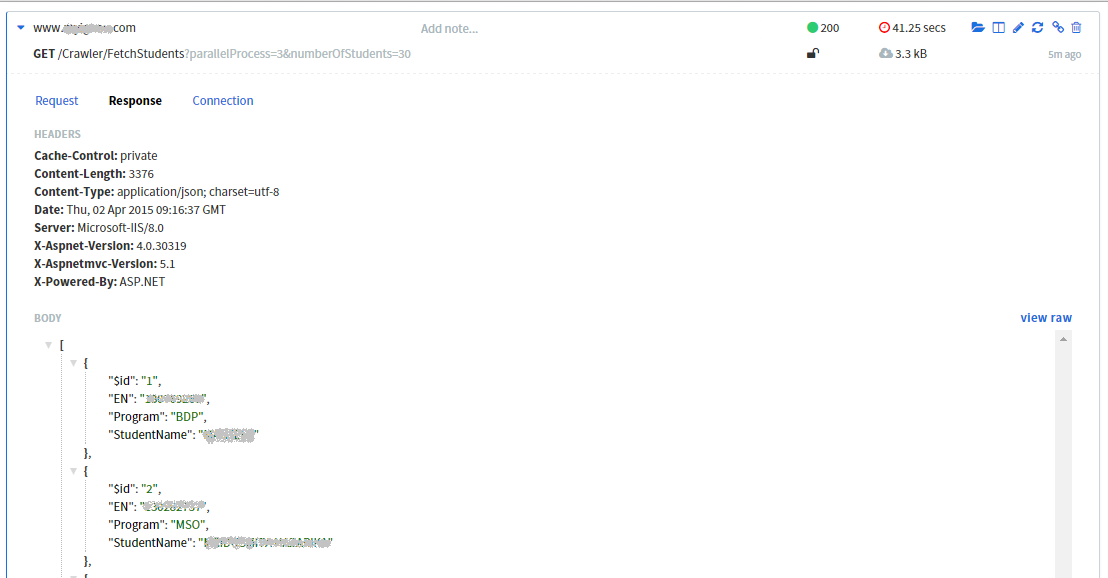
You can click particular request to reveal details of the request. You will find all the details of request and response both including all request and response headers, cookies, request data (from query string and form data if post request), and complete response body. It can parse the JSON response to expandable/collapsible regions. Below you can find how it looks when you click on a request to see all the details.
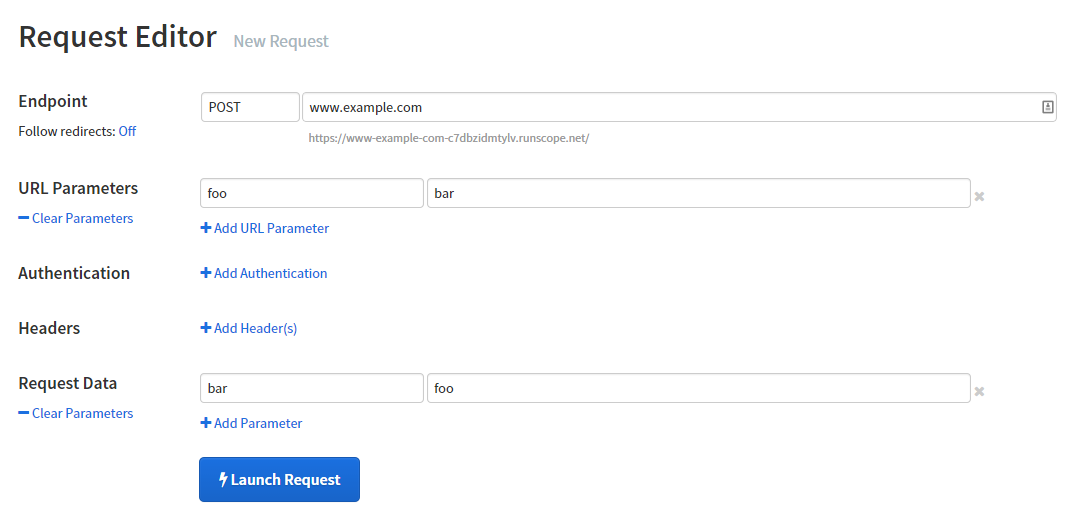
You can create a new HTTP request by just specifying the request method and URL for the request. You can also specify query string and post data (or even raw post body) through user user-friendly name value collection form. All the requests made manually will be logged as well so you can see them later. Below is the form for creating a new request.
You can edit an existing request by choosing the edit action from the traffic inspector page. You can edit form values, query string; headers etc. and launch the modified request again.
You can also share an existing request with others using their share request tool. A permalink will be generated for others to access your request. You can always cancel a share link that was created to revoke access to the request which you had shared previously.
They have a system called Radar, where you can schedule tests, set rules for alert like ‘send an alert if response contains or not contains a specific word’. You can set various rules for alert notifications. You can also choose the service region where from the requests will be originated.
Runscope has developed a tool called Passageway using which you can temporarily expose your local host to the public using internet. You need to install a command line utility which you can download from their website. All your requests and responses will be logged in the runscope so you can monitor and debug them in real time. You can check their documentation for more details.
Mar 14th, 2024
Taxi Booking App Development Company in Singapore
Mar 12th, 2024
The contemporary information technology (IT) landscape is characterised by an exponential growth in data generation, primarily occurring at the network’s edge. This surge poses a challenge to traditional, centralised computing […]
Mar 5th, 2024
How to use Google’s new Gemini AI